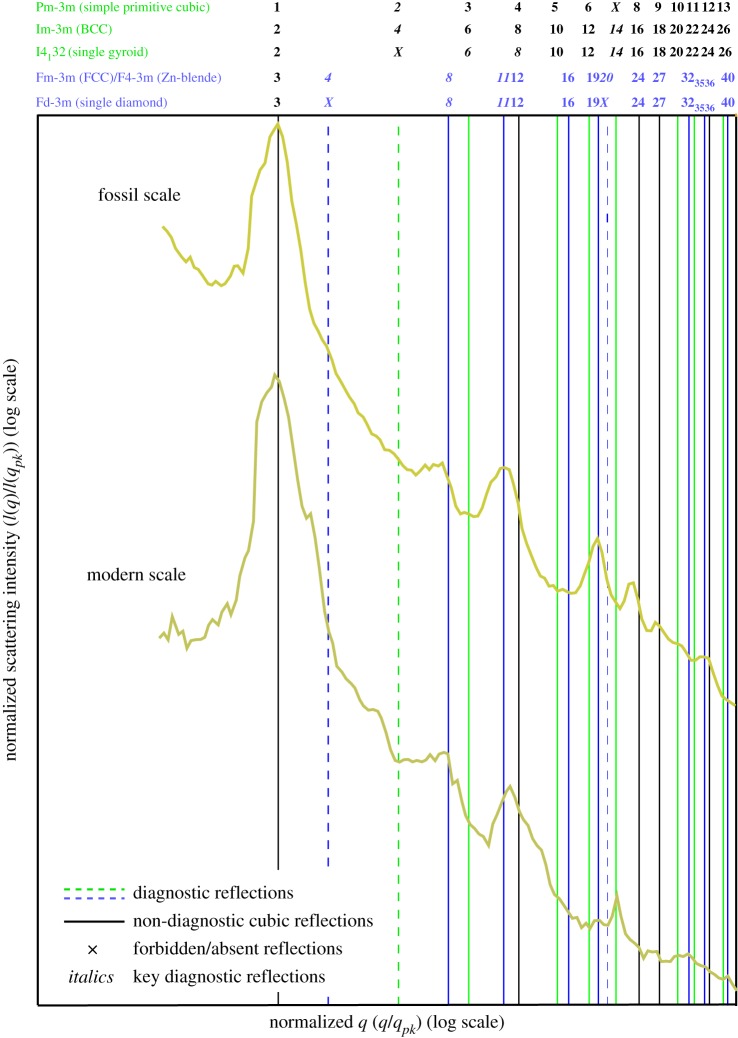
Figure 4.
Structural diagnoses of normalized, azimuthally averaged SAXS profiles integrated from the respective two-dimensional SAXS patterns of photonic scales in figure 2. Vertical lines denote expected Bragg peak positional ratios for various cubic crystallographic space groups. Numbers above the vertical lines are squares of the moduli of the Miller indices (hkl) for the allowed reflections of the cubic space-groups. The normalized positional ratios of the scattering peaks are indexed to the predictions of specific crystallographic space-groups or symmetries following IUCr conventions [24]. (Online version in colour.)

