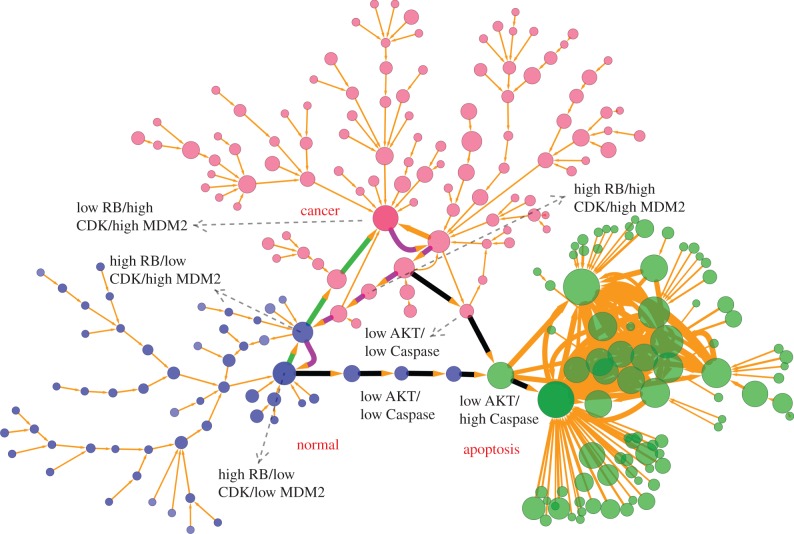
Figure 3.
Discrete landscape for cancer network with 247 nodes (every node denotes a cell state, characterized by expression patterns of the 21 marker genes) and 334 edges (paths) at default parameter values (a = 0.5, b = 0.5, k = 1). The sizes of nodes and edges are proportional to the occurrence probability of the corresponding states and paths, respectively. Blue nodes represent states closer to normal cell states, red nodes represent states closer to cancer cell states and green nodes represent states closer to apoptosis cell states. The green and magenta paths denote dominant kinetic paths from path integrals separately for normal to cancer attractor and cancer to normal attractor, and black paths represent the apoptosis paths for normal and cancer states. Here, we demonstrate only the states and paths with higher probability by setting a probability cutoff. The largest blue node (high RB/high AKT/low Caspase) represents the major normal state, the largest red node (low RB/high AKT/low Caspase) represents the major cancer state, and the largest green node (high RB/low AKT/high Caspase) represents the major apoptosis state. Some key intermediate states along the kinetic paths also have been labelled with high or low expression level.

