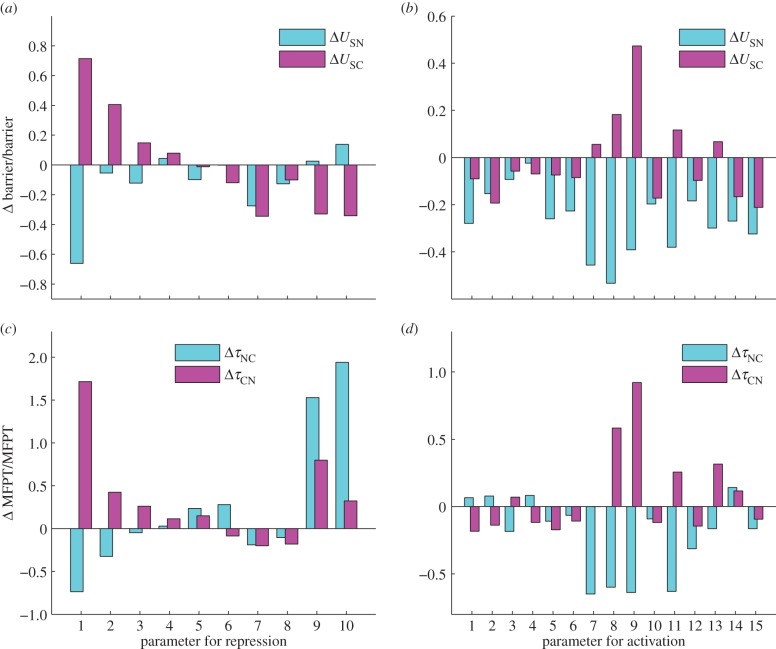
Figure 6.
The effects of key parameters (10 repression parameters and 15 activation parameters) on the barrier (USN and USC) and MFPT (mean first passage time, τNC and τCN) from Langevin dynamics. Y-axis represents the percentage of barrier or MFPT changed. Here, USN represents the potential difference between the saddle point (between normal attractor and cancer attractor) and the local minimum in normal attractor. USC represents the potential difference between the saddle point (between normal attractor and cancer attractor) and the local minimum in cancer attractor. τNC represents the MFPT from normal attractor to cancer attractor. τCN represents the MFPT from the cancer attractor to the normal attractor.

