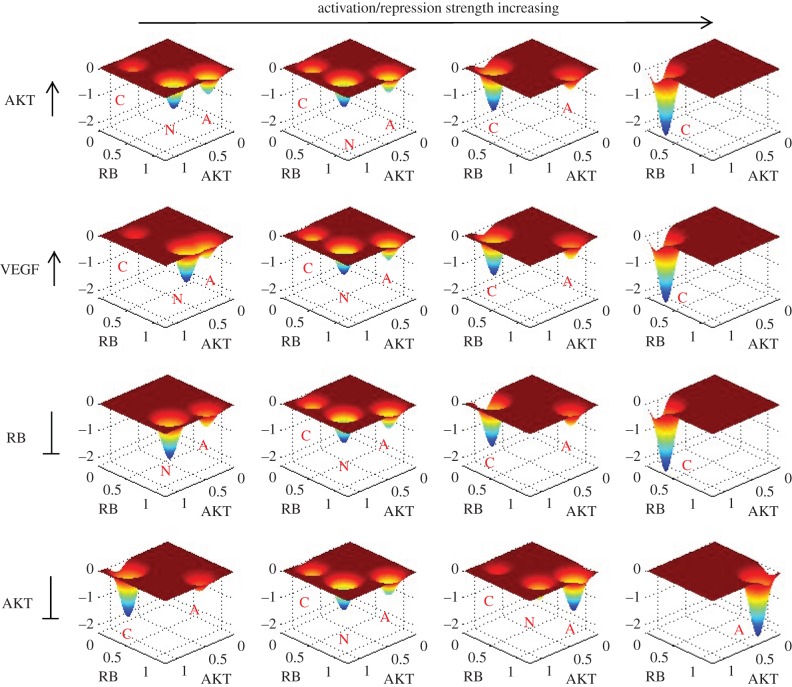
Figure 7.
The change of landscape when some key regulation strengths (activation and repression parameters, Mji) are changed. The vertical axis of every sub-figure represents –P ×1000 (P is probability and −P corresponds to potential energy U). From left column to right column separately corresponds to: s =−50%, 0%, 50% and 100% (here s represents the percentage of parameters changed). The four rows separately correspond to the change of four parameters. As labelled, the first row represents activation strength from VEGF to AKT, the second row represents the activation strength from AKT to VEGF, the third row represents the repression strength from CDK2 to RB and the fourth row represents the repression strength from PTEN to AKT. The labels C, N and A represent cancer attractor, normal attractor and apoptosis attractor, respectively.

