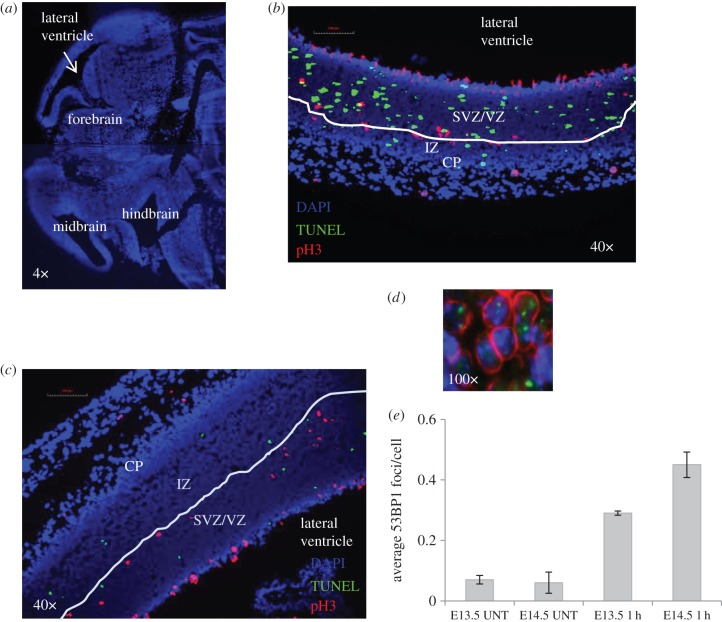
Figure 1.
Optimization of the detection of DSBs and apoptosis in the embryonic neuronal compartment. (a) An orientation figure to show the region of the embryonic brain undergoing analysis. For orientation, the lateral ventricle is highlighted in subsequent figures. Further details of the region scored for DSB analysis are shown in c and d and for apoptosis analysis in figure 2a. Embryos were exposed to 100 mGy X-rays in utero at E13.5 (b) or E14.5 (c). Mitotic cells were stained using pH3 (red) to delineate the upper boundary between the VZ/SVZ and the IZ. Apoptotic cells are identified by TUNEL staining (green). DAPI staining is shown in blue. The less brightly staining DAPI region encompasses the VZ/SVZ and IZ (the stem and early progenitor cell compartment). The more brightly staining DAPI region represents the cortical plate (CP). The images (40×) show the VZ/SVZ and IZ layers separated by pH3 mitotic cell border, which is highlighted by the white line. At E13.5, the IZ region is very small and the VZ/SVZ occupies the greater part of the less brightly staining DAPI region (b). By E14.5, the IZ region has enlarged and the VZ/SVZ and IZ are of similar size (c). pH3 staining was not employed for the analysis encompassed in this paper. For 53BP1 foci analysis, an arbitrary line was drawn midway between the ventricle and the CP (brightly staining DAPI region) and 53BP1 foci were enumerated in the half most distal from the ventricle. Trial experiments showed that the precise position of the line did not appreciably affect the number of 53BP1 foci scored. (d) Cell delineation using lamin B staining (red) with processing for immunofluorescence using α-53BP1 antibody (green) after exposure to 100 mGy IR. 53BP1 foci were expressed per cell number scored. (e) The enumeration of 53BP1 foci at E13.5 or E14.5 in unexposed embryos (UNT) or following exposure to 50 mGy at E13.5 or E14.5.

