
Figure 2.
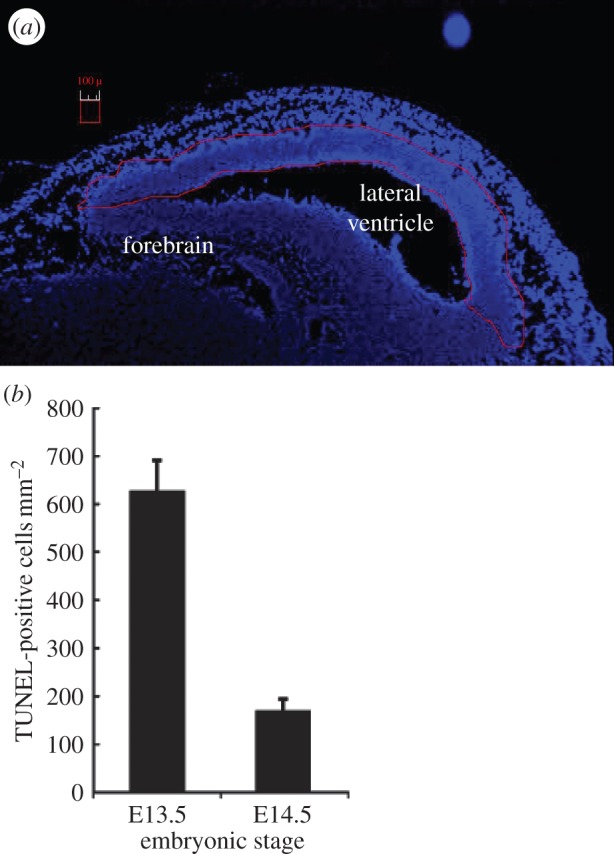
The frequency of apoptotic cells at E13.5 versus E14.5. For analysis of apoptosis, the entire stem and early progenitor compartment of the forebrain was delineated for scoring as marked by the red line in a. At this low magnification, apoptotic cells are not visible. (b) The frequency of apoptotic cells in the VZ/SVZ after exposure to 100 mGy at E13.5 or E14.5 (scored using higher power magnification). The number of TUNEL-positive cells was estimated after normalizing to the area scored (i.e. TUNEL-positive cells per square millimetre).