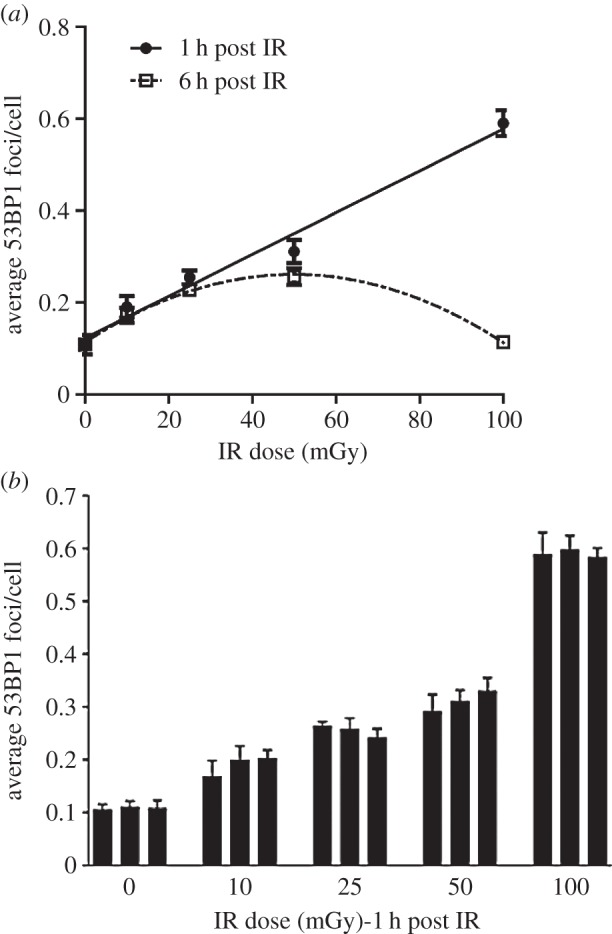
Figure 3.

Analysis of 53BP1 foci formation and disappearance in the IZ region after in utero exposure of embryos to X-rays. (a) Quantification of 53BP1 foci at 1 and 6 h in the IZ compartment following exposure to 10–100 mGy IR. Embryos (E13.5) were exposed in utero to X-rays and processed to monitor 53BP1 foci formation at 1 and 6 h post exposure. Results represent the mean of two sections from three embryos from each of three mothers. SEMs are within the data points where not evident. The line represents a linear fit to the data points at 1 h post irradiation. (b) The variation in DSB formation for individually irradiated mothers at each dose. Each bar line represents the mean of two sections from each of three embryos derived from a single mother. The errors bars represent the standard deviation. All analysis in this and all figures was carried out blindly.
