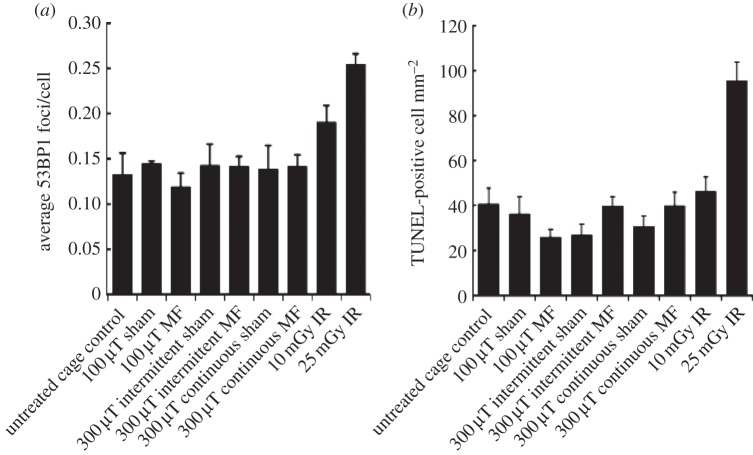
Figure 6.
Level of 53BP1 foci and apoptosis following 50 Hz magnetic field exposure. (a) Quantification of 53BP1 foci in embryos exposed as presented in figure 5. The control group represents the mean of all the untreated cage control embryos carried out in parallel to the sham or magnetic field-exposed embryos (and are distinct to the controls used in the experiments involving X-ray exposure). The results represent the average of two sections from each of three embryos from each of three mothers (i.e. 18 sections). (b) Quantification of apoptosis in the embryos following the treatments shown. Results for X-ray exposure are the same as those shown in figure 4 for the given doses. (MF, magnetic field.)

