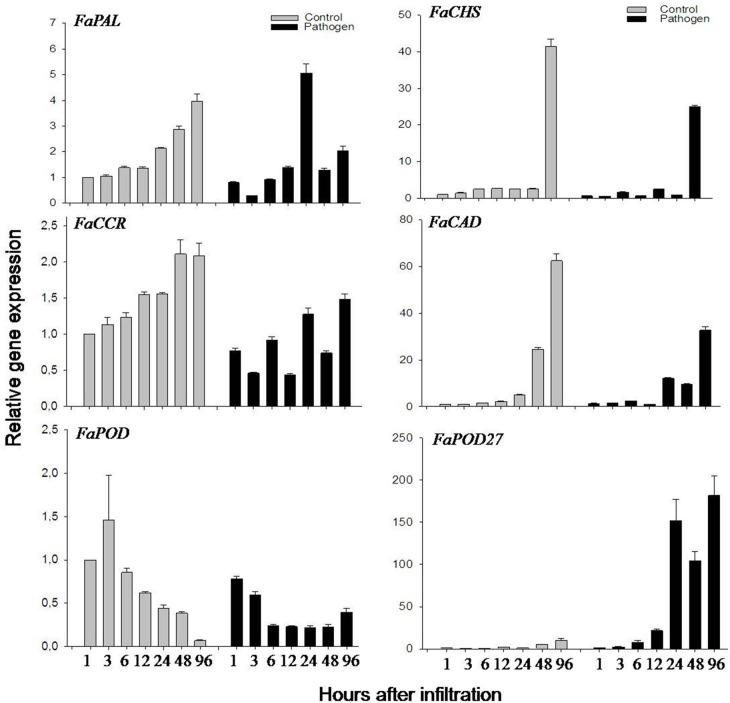
Figure 3.
Relative expression profiles of phenylpropanoid biosynthesis genes of F. × ananassa cv. Elsanta in response to Agrobacterium. Expression levels in control (gray column) and agroinfiltrated fruits (black column) were monitored by qRT-PCR at different time points (1, 3, 6, 12, 24, 48, and 96 h). FaPAL. FaCHS, FaCCR. FaCAD. FaPOD, and FaPOD27 were target genes. The control fruit (1 h) was used as the reference with one for each graph. Values are mean ± SE of 2–3 replicates from one fruit and are shown as relative changes.

