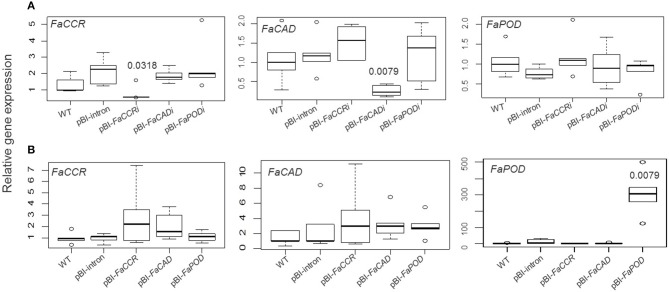
Figure 7.
Relative expression profiles of down- (A) or up-regulated (B) monolignol genes in F. × ananassa cv. Elsanta. Total RNA was isolated from a single untreated fruit (wild type; WT), control fruits (pBI-intron), down-regulated fruits (pBI-FaCCRi, pBI-FaCADi, and pBI-FaPODi) (A), and up-regulated fruits (pBI-FaCCR, pBI-FaCAD, and pBI-FaPOD) (B). Expression levels of all samples were monitored by qRT-PCR with specific primers for target genes (FaCCR. FaCAD, and FaPOD) and an interspacer gene. The latter was used as an internal control for normalization. For each box-plot graph, one of the WT group was used as the reference (set to one) and each group contained five biological replicates. The Wilcoxon-Mann-Whitney U-test was used for a non-parametric comparison of two groups from pBI-intron and fruits infiltrated with different constructs. Values indicate statistically decreased and increased levels (P < 0.05) and are shown in the box.

