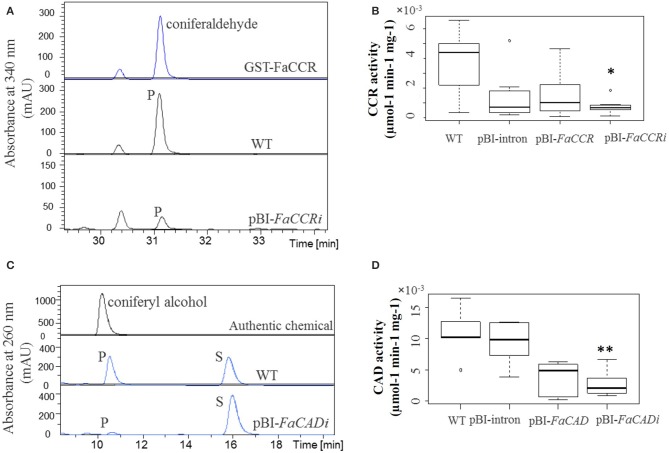
Figure 8.
CCR (A,B) and CAD (C,D) specific activity in wild-type and agroinfiltrated fruits. (A) Coniferaldehyde (P; products) formed in the reactions was quantified at 340 nm. (B) Untreated fruits (WT), control fruits (pBI-intron), pBI-FaCCR, and pBI-FaCCRi; each group n = 7. (C) Coniferyl alcohol formed in the reactions (P = coniferyl alcohol; S = coniferaldehyde) was quantified at 260 nm. (D) WT, pBI-intron, pBI-FaCAD, and pBI-FaCADi fruits; each group n = 6. The Wilcoxon-Mann-Whitney U-test was used for a non-parametric comparison of two groups. One asterisk (*) or two asterisks (**) in the box mark statistically significant decreased levels (P < 0.02) in comparison with WT and another group (indicated by *), or in comparison with either WT or pBI-intron and another group (indicated by **).

