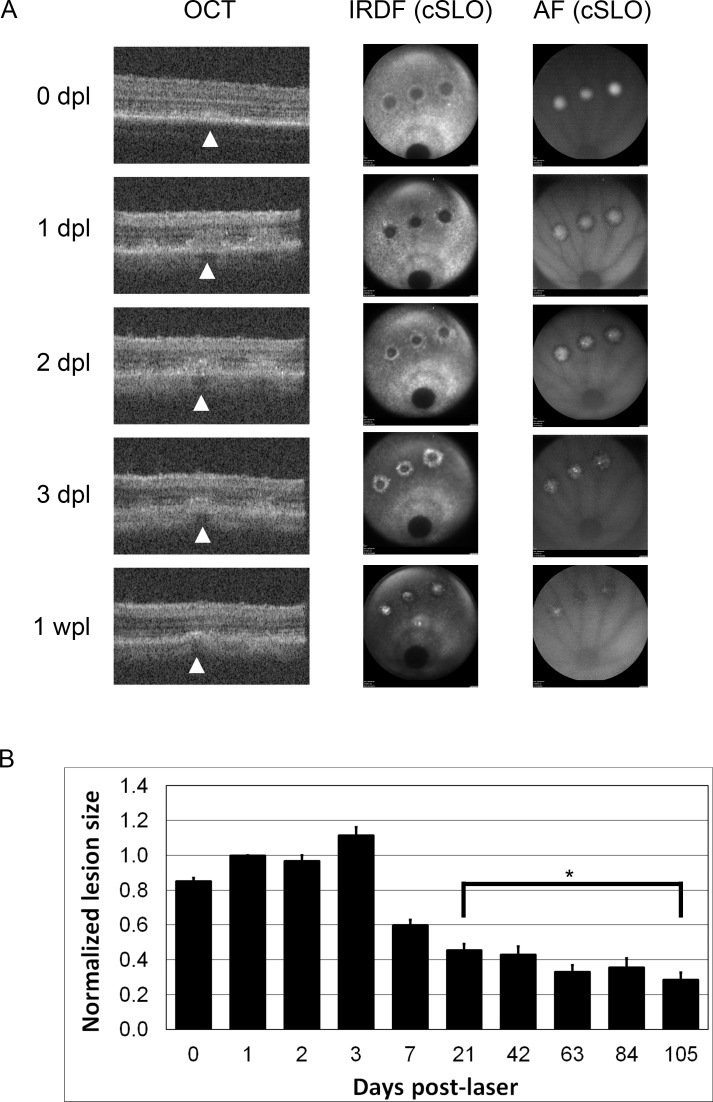
Figure 2.
Optical coherence tomography and cSLO images of laser lesions up to 1 wpl. (A) Optical coherence tomography and cSLO images taken at various time points post laser lesion from a single animal. Arrowheads point to the central lesion on OCT. The representative B-scan images are centered on the central lesion, but all three lesions can sometimes be seen on a single B scan depending on the eye orientation (1, 2, and 3 dpl). Three discrete laser lesions can be seen on cSLO imaging. The optic nerve is visible at the bottom of each cSLO image. (B) Histogram of normalized lesion size measured by IRDF up to 15 wpl. Asterisk denotes time points without significant differences in lesion size. Total n for each time point: 0 dpl = 122, 1 dpl = 95, 2 dpl = 33, 3 dpl = 24, 1 wpl = 46, 3 wpl = 47, 6 wpl = 40, 9 wpl = 34, 12 wpl = 31, 15 wpl = 22.

