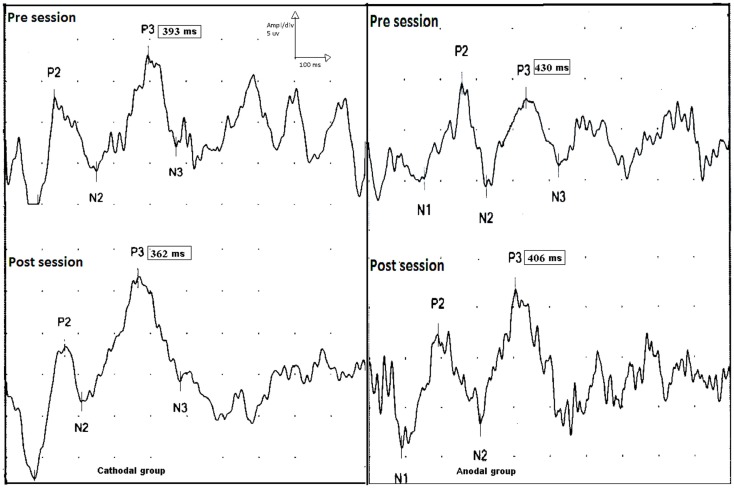
Figure 5.
P300 event-related potential, upper traces show p300 latencies and amplitudes before session (upper trace) in the cathodal (left side) and anodal stimulation (right side). Lower traces show the effect tDCS (post session) on the latencies of p300 on both groups. There is a shortening in p300 latencies post sessions in both groups (pre and post sessions for cathodal stimulation; 393 and 362 ms, and pre and post sessions 430 and 406 ms for anodal stimulation).

