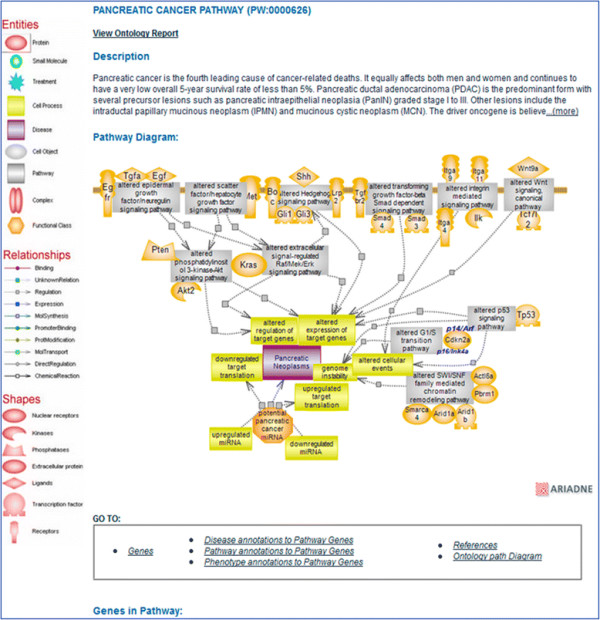
Figure 2.

Pancreatic cancer pathway diagram page. The interactive pathway diagram page for the ‘pancreatic cancer pathway’. The altered pathways implicated in the condition are shown as gray rectangles, and they link to their respective ontology report pages. Culprit genes within each pathway are shown color-coded (the default color is red). The icon for the microRNAs (miRNAs) potentially implicated in the condition links to a page where several miRNAs are listed with additional links and references. The disease icon links to the Cancer Disease Portal in RGD.
