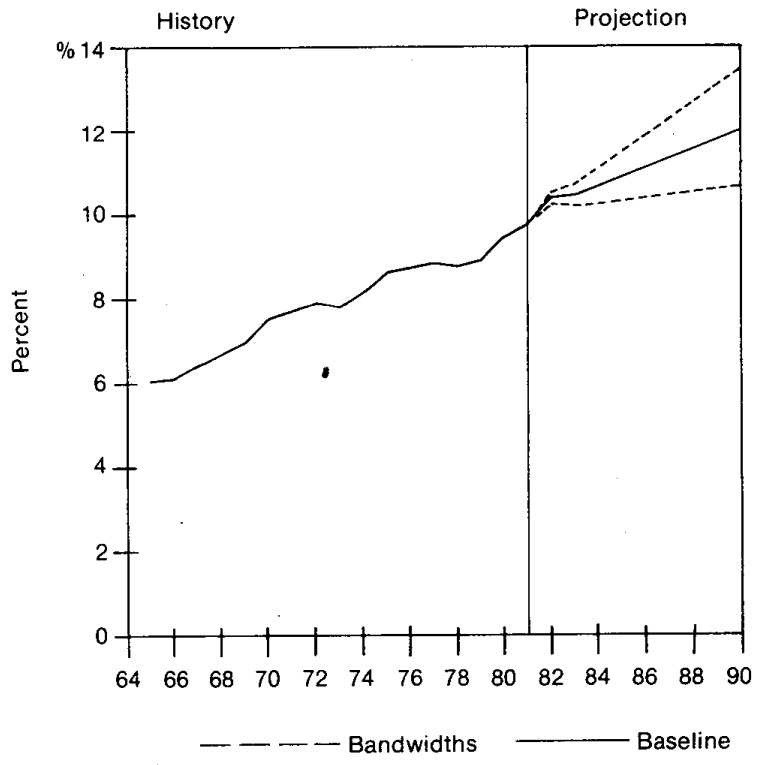
Figure 2. The Share National Health Expenditures are of GNP 1965 to 1990, with Bandwidth Intervals1.
1The bandwidth intervals around the baseline projection scenario provide one indicator of variability. The standard error associated with annual percent increases in the ratio of national health expenditures to GNP for 1966-1981 (see Table A-11) was multiplied by a t-distribution value of 2.131 to derive the bandwidth intervals. The calculated bandwidth intervals are approximate and are used as a rough guide in assessing variability and uncertainty.

