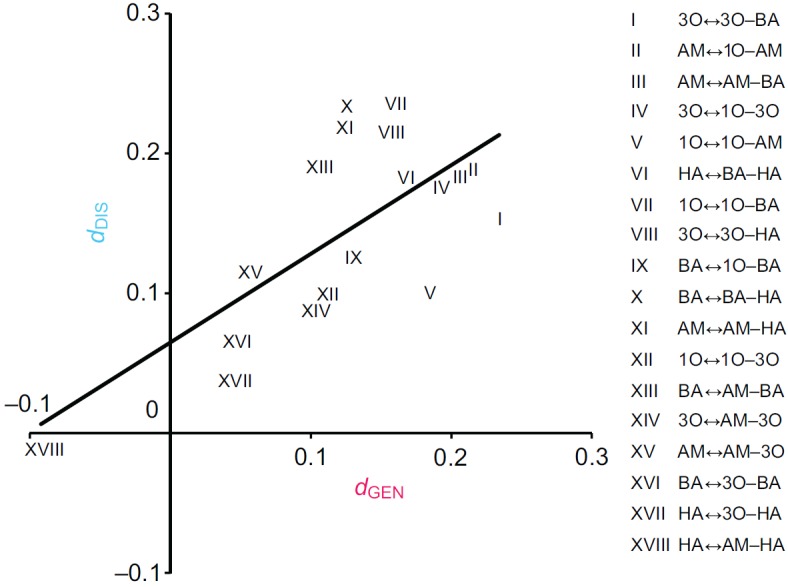
Fig. 4.

Correlation of perceptual distances derived from generalization and discrimination tasks. Measures of element–mixture perceptual distances correlate between generalization and discrimination tasks. The plot presents dDIS on the y-axis and dGEN on the x-axis (Spearman's rank correlation: rS=0.52, P<0.05, N=18). See Fig. 1 legend for odour definitions.
