
Figure 2.
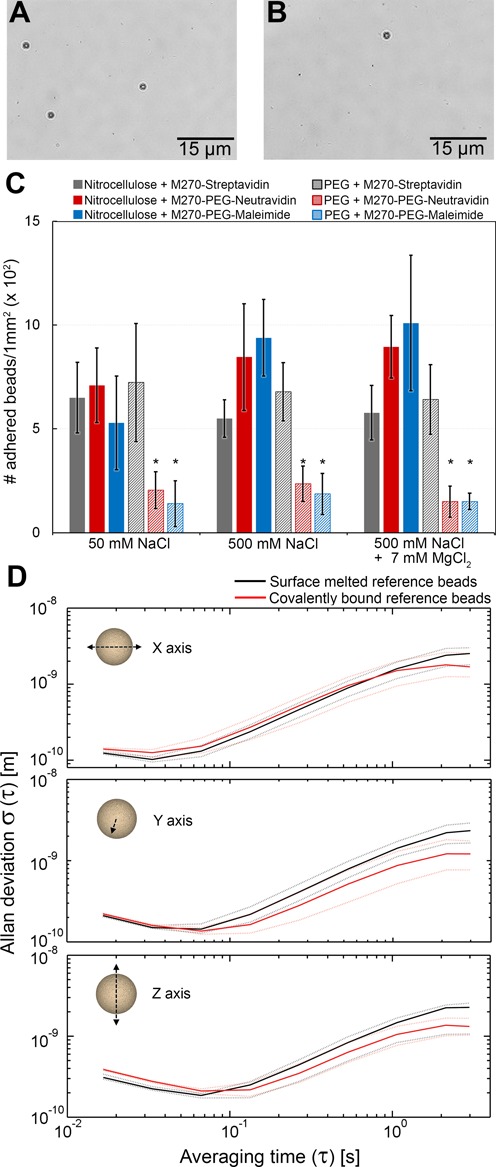
Non-specific adhesion and spatial stability of beads. (A and B) Images of a flow cell with non-specifically adhered magnetic beads. (C) The number of adhered magnetic beads is summarized in the histogram for different combinations of bead-surface for a variety of buffer conditions. The error bars represent the mean standard deviations and the asterisks denote the significance threshold level of the applied analysis of variance (1-way ANOVA; *P < 0.05) for each buffer condition. (D) The position stability of reference beads affixed via surface-melting (black) or covalent attachment (red) is analyzed by computing their respective Allan deviations (48) as a function of time in all three dimensions. For each attachment method, the median of n = 25 reference beads is presented as continuous lines and the 25th and 75th percentiles as dashed lines.