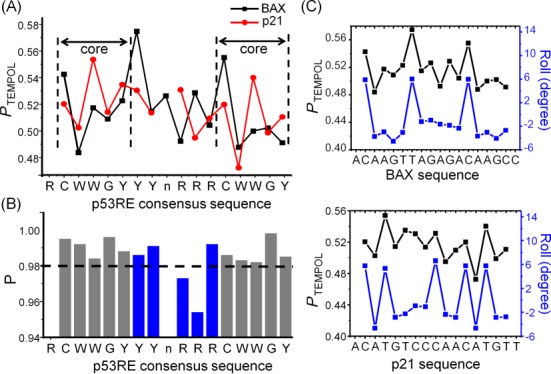
Figure 5.

R5a mobility maps reveal DNA duplex shape. (A) Plots of PTEMPOL along BAX (black) and p21 (red) sequence. (B) Pair-wise P-values between spectra acquired at corresponding sites along the two DNAs. The CWWG core regions were shown in gray, and the central region in blue. A dashed line was drawn at P = 0.980 to aid visualization. (C) Comparisons between the PTEMPOL map (black) and that of Roll (blue) for BAX (top panel) and p21 (bottom panel). PTEMPOL value was aligned to the Roll value of the base-pair step 3′ of the spin-labeled phosphate. Pearson's coefficients between the two maps were 0.848 and 0.685, respectively, for BAX and p21.
