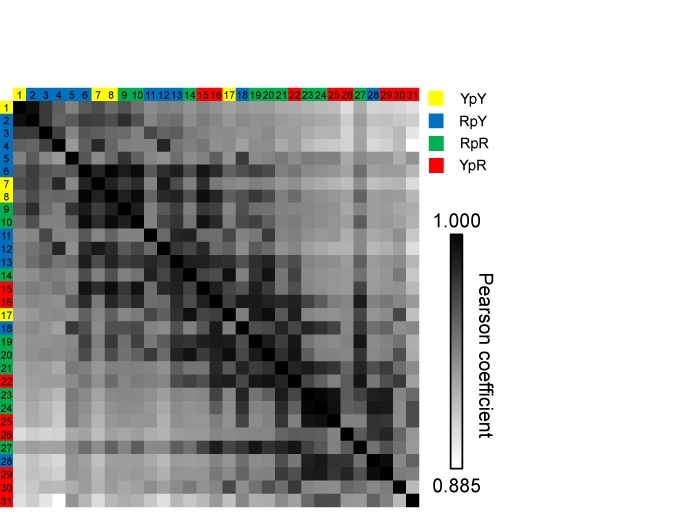
Figure 6.

A matrix of the pair-wise Pearson's coefficients obtained with 31 R5a spectra. For clarity each spectrum was assigned a number, with the key given in Supplementary Table S2. Each cell was color-coded in gray-scale based on the P-value between spectra identified by the respective row and column labels. The row/column labels are color-coded based on the di-nucleotide step as shown in the figure legend.
