
Figure 1.
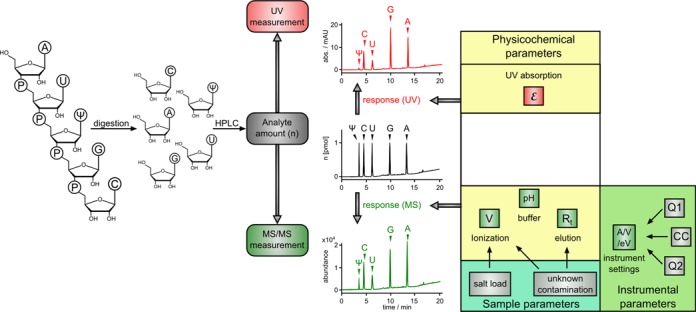
Correlation of absolute analyte amount and signal intensity using UV and MS/MS measurements. As an example, an oligomer with equimolar amounts of each depicted nucleoside is digested and separated by column chromatography. The chromatograms above (UV) and below (MS/MS) represent the effect of the response factors on the signal intensities. The UV signal is essentially dependent on only the absorption coefficient ϵ, which is mildly dependent on solvent composition and pH. The MS/MS signal is subject to significant and varying influence by several physicochemical properties, sample parameters and instrumental parameters that cannot be assessed in one generally applicable parameter (legend: V, volt; Rt, retention time; A, ampere; eV, electron volt; Q1(2), quadrupol1(2) and CC/collision cell).