
Figure 2.
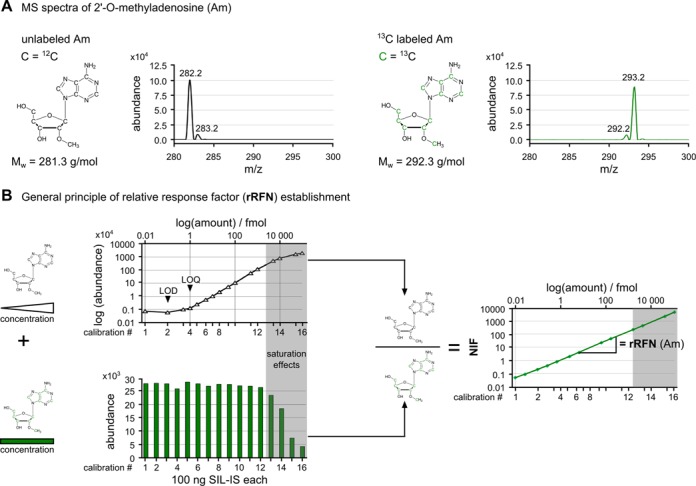
Determination of response factors by usage of commercial Am and 13C Am from SIL-IS. (A) MS spectrum of unlabeled 2′-O-methyladenosine (Am) (left) and 13C-labeled Am (right). (B) Upper left: calibration measurements of commercially available, unlabeled Am. At high substance amounts, a flattening of the calibration curve due to saturation effects is highlighted in gray. Below, the signal intensity for constant amounts of 13C-labeled Am in the presence of increasing unlabeled Am amounts is shown. Here, the drop in signal intensity due to saturation can also be observed in the gray area. Right: By division of corresponding MS signals of unlabeled and 13C labeled Am, the NIF is received and a dynamic calibration curve can be plotted. The slope of the linear fit represents the relative response factor for Am = rRFN (Am).