Figure 5.

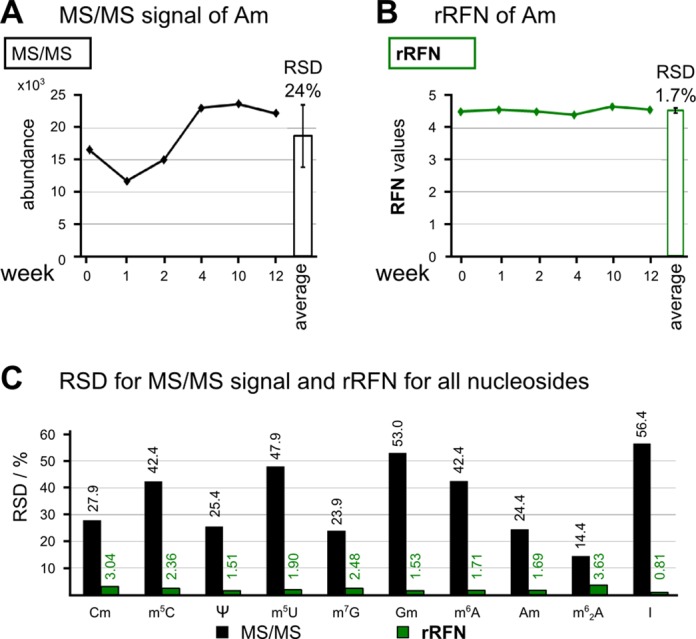
Reproducibility of rRFN values over 12 weeks. Relative standard deviations (RSDs) in % for the MS/MS signal and the isotope normalized signal of 2’-O-methyladenosine (Am) over a period of 12 weeks. (A) MS/MS abundance of constant amounts and average abundance with RSD. (B) Relative response factor (rRFN) of Am obtained by the measurements shown in (A). (C) RSD of MS/MS signal and rRFN for 10 modified ribonucleosides after 12 weeks. In black, the RSD in % of the MS abundance without 13C SIL-IS-based correction is shown. RSDs of the respective rRFN are in green.
