
Figure 1.
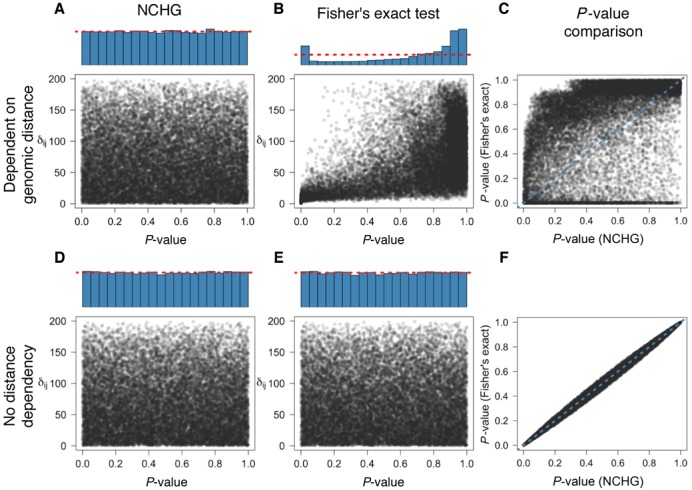
Comparison of Fisher's exact test and the NCHG test using simulated data. P-values are plotted against the genomic distance (δij), defined as the number of anchors between i and j. Blue histograms indicate the distribution of P-values, calculated as explained in the ‘Materials and Methods’ section. (A) P-values obtained using the NCHG test on data sampled with strong dependency on genomic distance. (B) P-values obtained using Fisher's exact test with strong dependency on genomic distance. (C) Comparison between P-values from the NCHG test and Fisher's exact test, for data sampled with strong dependency on genomic distance (Pearson's r ∼ 0.49). (D) P-values obtained using the NCHG test on data sampled without any dependency on genomic distance. (E) P-values obtained using Fisher's exact test on data sampled without any dependency on genomic distance. (F) Comparison between P-values from the NCHG test and Fisher's exact test, for data sampled without any dependency on genomic distance (Pearson's r ∼ 0.99). Red dashed lines indicate the expected fraction for a uniform distribution of P-values.