
Figure 2.
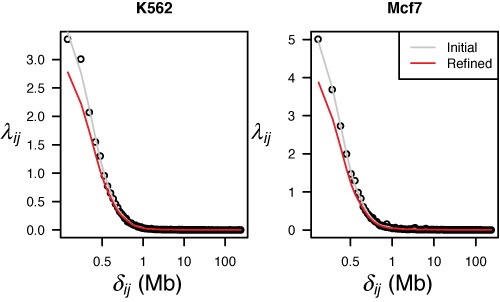
Dependency on genomic distance for the initial (gray) and the refined (red) interactions. Genomic distance (δij), defined as the distance between pairs of anchors, plotted against the observed average number of interactions. The gray line shows the result after cubic spline smoothing on the original, non-refined dataset. The red line shows the smoothed dependency for the refined dataset, which gives the expected interaction frequencies (λij), as explained in the ‘Materials and Methods’ section. Results for K562 (left) and Mcf7 (right) are shown.