
Figure 4.
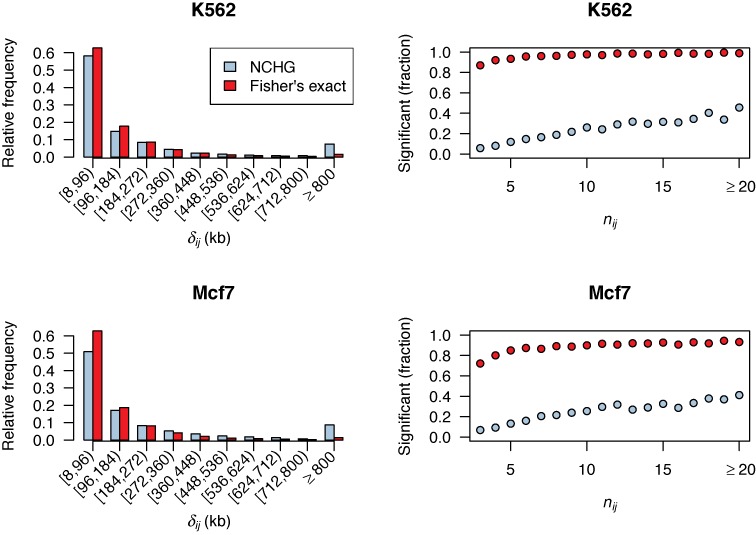
Left: bar-plots showing the relative frequencies of genomic distances (δij) for the significant interactions using Fisher's exact test (red bars) and the NCHG test (blue bars), divided into 10 groups of genomic distances. Right: fraction of significant interactions, relative to all possible interactions, plotted against the number of observed interactions nij. Red circles indicate results using Fisher's exact test, while blue circles indicate results using the NCHG test. Results for K562 (top panels) and Mcf7 (bottom panels) are shown.