
Figure 6.
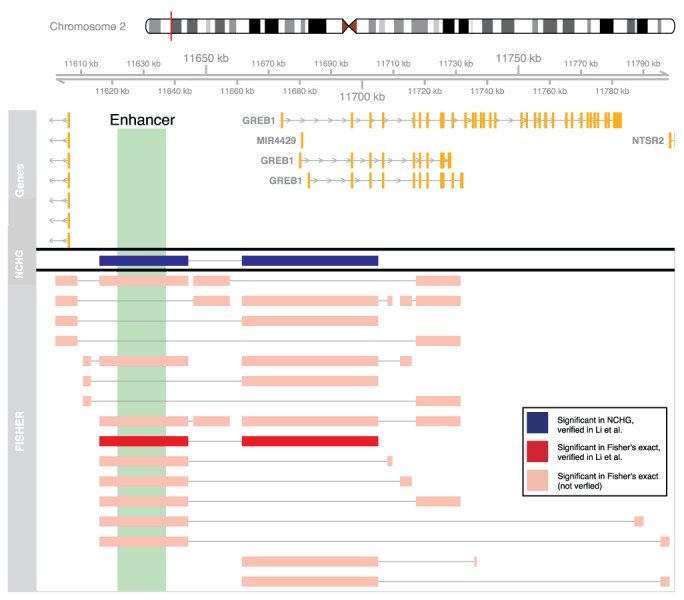
Significant interactions involving the GREB1 gene for the Mcf7 cell line. Significant interactions are shown as connected segments. Segments colored dark red and dark blue are verified (using 3C) in Li et al. (12). Interactions between pink segments indicate interactions found using Fisher's exact test that have not been verified previously.