Figure 1.

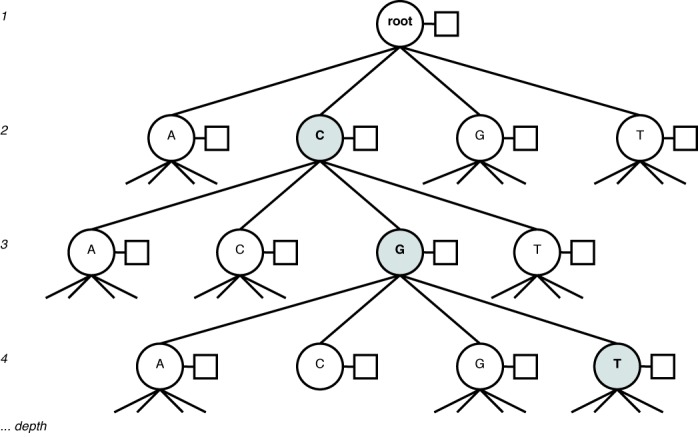
N-ary tree representation of a Markov model, with the context ‘CGT’ highlighted. Each node (circle) has an associated frequency table (box) over the next base in the sequence following the context.

N-ary tree representation of a Markov model, with the context ‘CGT’ highlighted. Each node (circle) has an associated frequency table (box) over the next base in the sequence following the context.