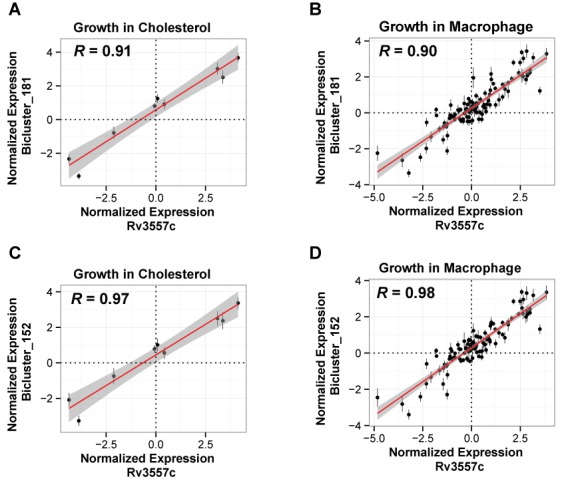
Figure 4.

The conditional regulation of KstR2 biclusters. The scatter plots show the correlation of expression for KstR2 versus the median correlation of gene members of bicluster_181 under (A) growth on cholesterol (R = 0.98, P-value = 5.6 × 10⁻⁶) and (B) growth in macrophage (R = 0.90, P-value < 2 × 10⁻¹⁶) and KstR2 versus gene members of bicluster_0152 under (C) growth on cholesterol (R = 0.97, P-value = 9.0 × 10⁻⁶) and (D) growth in macrophage (R = 0.91 and P-value < 2 × 10⁻¹⁶). Error bars show the standard deviation of bicluster gene expression. The number of data points in each plot equals the number of transcriptome profiles in the environmental context shown in the plot.
