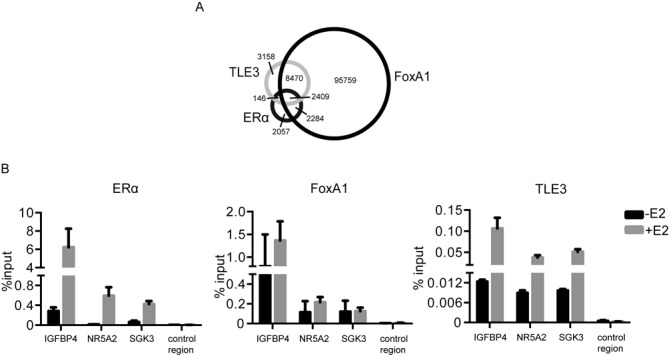
Figure 3.

FoxA1, ERα and TLE3 share several binding sites throughout the genome. (A) Venn diagram representing the shared binding sites of FoxA1, ERα and TLE3. The ChIP assays were performed in MCF-7 cells grown in full medium. (B) ChIP assays in MCF-7 cells after treatment with vehicle (-E2, ethanol, 0.1%) or E2 (+E2, 10−7M) for 30 min with antibodies raised against ERα, FoxA1 and TLE3 at the regulatory elements of IGFBP4, NR5A2 and SGK3 (primers described in Supplementary Figure S4) and the control region of TFF1 locus (primer b). The results presented are average of at least two independent experiments (Student's t-test * = P < 0.05; ** = P < 0.01).
