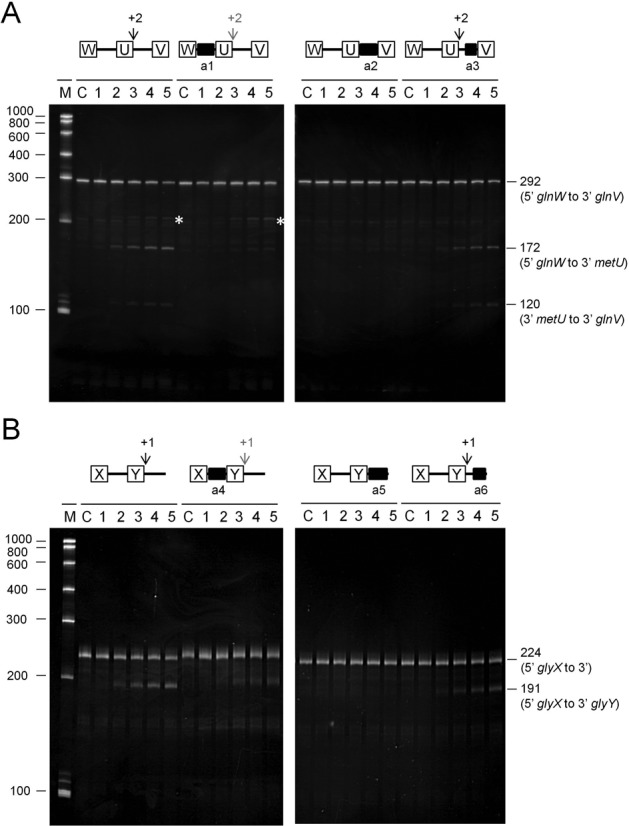
Figure 6.

Analysis of direct entry cleavage in metT and glyV tRNA precursors. The cleavage assays, analysis of products and labelling are as Figure 5. (A) and (B) show the analysis of the glnW-metU-glnV and glyX-glyY tRNA precursors, respectively. A schematic diagram showing the positions of the sites of direct entry-cleavage (vertical arrow) and binding of a complementary oligonucleotide (closed black box) is provided for each transcript. White asterisks in (A) identify the production of a 209-nt species that is described in the main text.
