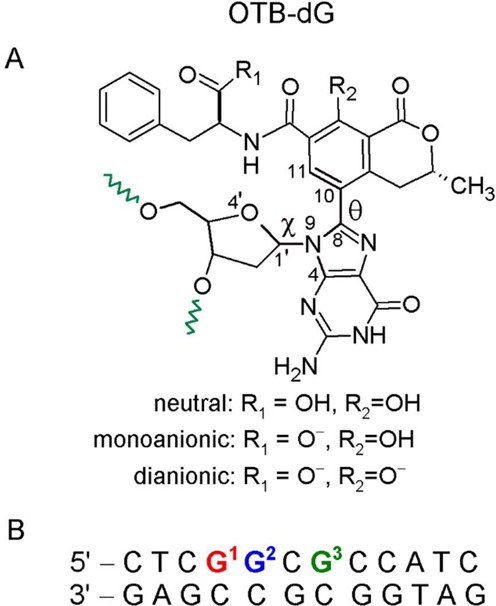
Figure 1.

(A) Chemical structure of the OTB-dG adduct. Green wavy bonds represent the 5′ and 3′ sites where the adduct is linked to the DNA backbone. Torsion angles χ at the sugar–nucleobase linkage and θ at the nucleobase–substituent linkage are defined as follows: χ = ∠(O4′–C1′–N9–C4) and θ = ∠(N9–C8–C10–C11). The OTB-dG adduct can exist in neutral (non-ionized), monoanionic (carboxylic group ionized) and dianionic (carboxylic and phenolic groups ionized) forms. (B) The 12mer NarI recognition sequence used for MD simulations, where the OTB–dG lesion was incorporated at the G1, G2 or G3 position.
