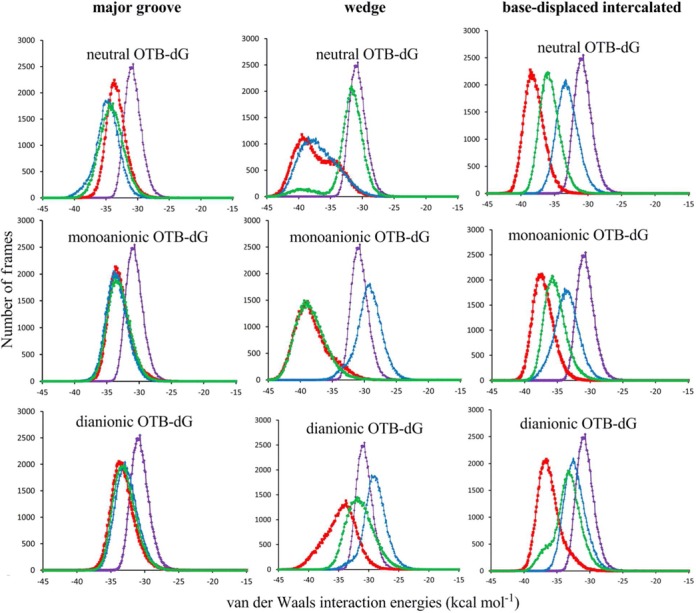
Figure 4.

Comparison of the stacking interaction energies involving the OTB-dG adduct in different ionization states at G1 (red), G2 (blue) or G3 (green) in the NarI recognition sequence. The average of the G1, G2 and G3 stacking interactions in the natural sequence is shown in purple.
