
Figure 2.
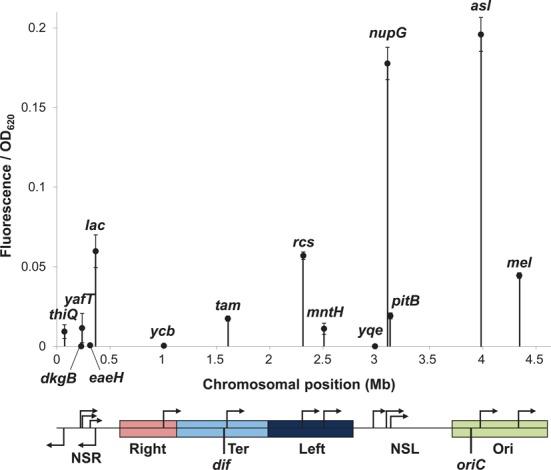
Effect of chromosomal position on reporter cassette expression. Fluorescence output from the reporter cassette was measured during growth in the presence of 100 μM IPTG and is represented on the y-axis as a function of OD620. In the absence of IPTG no fluorescence was detected. The location and orientations of each reporter cassette insertion site is indicated on the x-axis and on the linear schematic of the genome below. The locations of the macrodomains and non-structured regions (NSR, Right, Ter, Left, NSL and Ori) and the origin (oriC) and terminus (dif) of replication are also indicated.