
Figure 6.
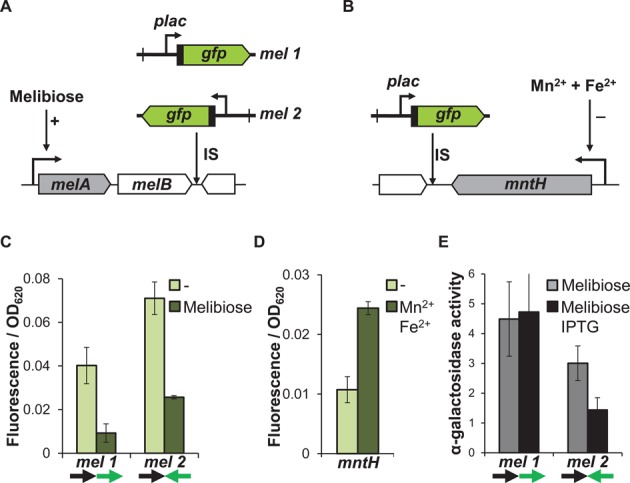
Active transcription has a negative effect on downstream promoters. (A) Schematic representation of gene organization at the mel locus. (B) Schematic representation of gene organization at the mntH locus. (C) Fluorescent output from the reporter cassette at the mel locus during growth with 100 μM IPTG, in the presence or absence of the inducer of the melAB operon, melibiose (0.2%). (D) Fluorescence output from the reporter at the mntH locus during growth with 100 μM IPTG, in the presence or absence of 10 μM MnCl2 and 10 μM (NH4)2Fe(SO)4. (E) α-galactosidase activity measured in strains with the reporter cassette inserted at the mel locus during growth with 100 μM IPTG or 0.2% melibiose. Arrows indicate co-directional (→→) or head to head (→←) transcription.