Figure 2.

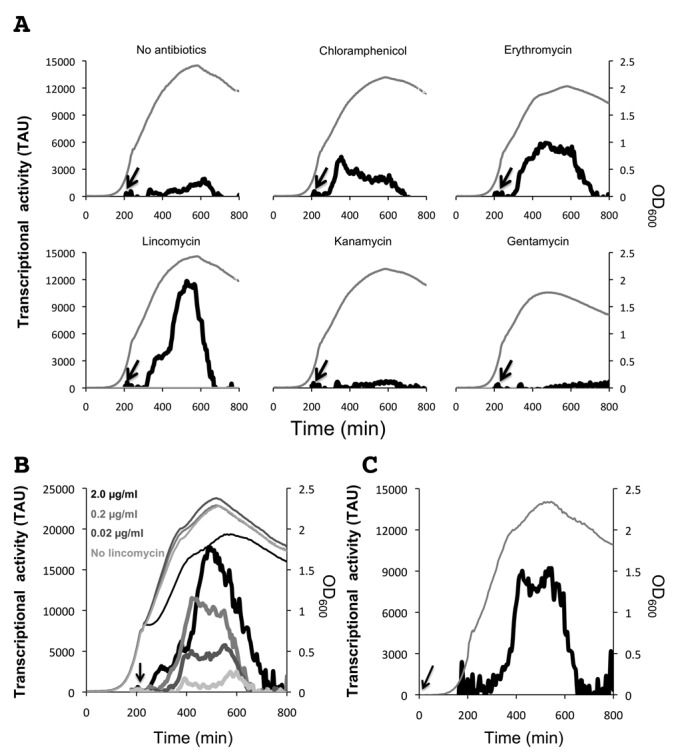
LCA real-time analysis of bmrCD transcription. A. Growth of B. subtilis BSBII-5′bmrC-gfp (OD600 nm; gray line) and bmrC transcriptional activity (solid black line) in response to the ribosome-targeted antibiotics chloramphenicol, erythromycin, lincomycin, kanamycin or gentamycin. Arrows indicate the time points at which antibiotics or an equivalent volume of water (‘no antibiotics’) were added. B. Dose-dependent response of 5′bmrC-gfp transcription to increasing concentrations of lincomycin. Bold lines indicate transcriptional activity and thin lines indicate bacterial growth. The arrow indicates the time point at which lincomycin was added. C. Transcriptional response of B. subtilis BSBII-5′bmrC-gfp to an early exposure to lincomycin. The bold line indicates transcriptional activity and the dashed line indicates bacterial growth. Lincomycin (final concentration: 0.02 μg/ml) was added at the start of the culture, as indicated by the arrow. Cultures entered the transition phase between exponential and post-exponential growth at OD600 of ∼1.
