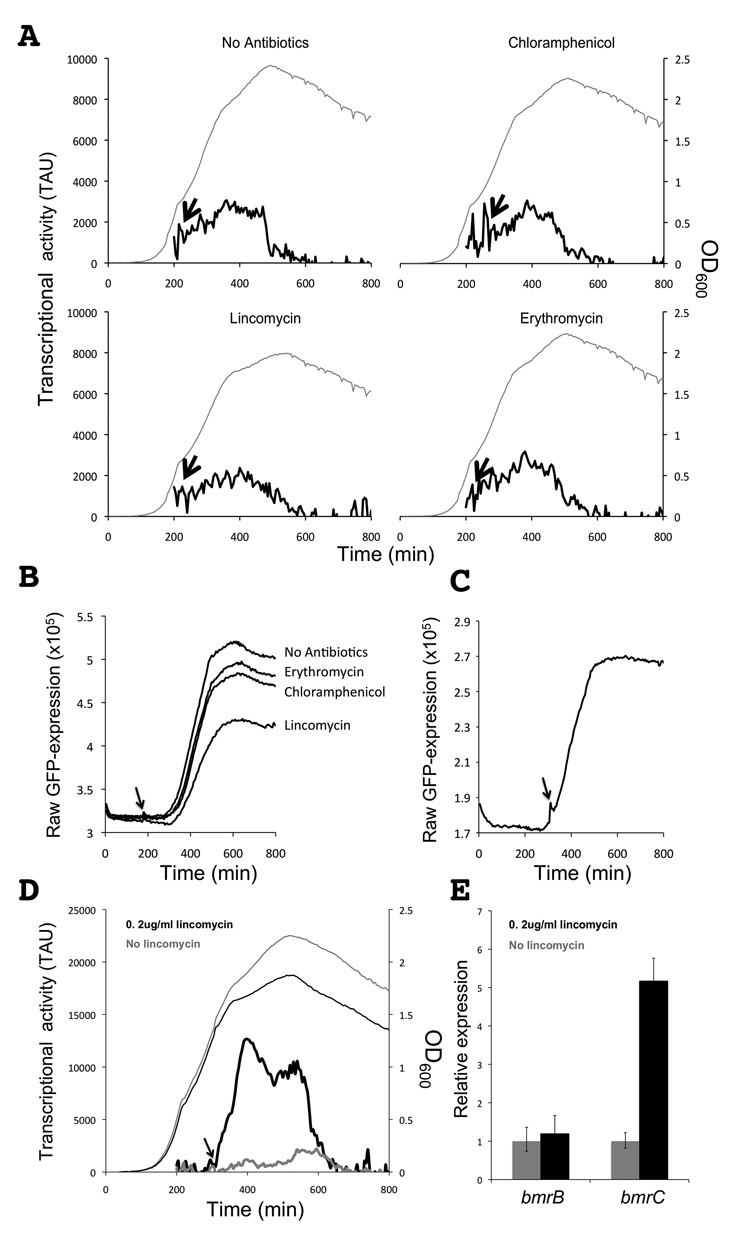
Figure 3.

LCA real-time analysis of bmrB transcription. A. Growth of B. subtilis BSBII-5′bmrB-gfp (OD600 nm; gray line) and bmrB transcriptional activity (solid black line) in response to chloramphenicol, lincomycin or erythromycin. Arrows indicate the time points at which antibiotics or an equivalent volume of water (‘no antibiotics’) were added. Cultures entered the transition phase between exponential and post-exponential growth at OD600 of ∼1. B. Graphs from raw GFP values as recorded with the Biotek synergy 2 plate reader. These raw values were used to calculate the TAU in panel A. Note that details of the transcriptional activity profiles in panel A are partly obscured by background noise. C and D. Lincomycin-induced transcription of the 5′bmrC-gfp fusion coincides with the time point at which transcription of the bmrB-gfp fusion starts to increase. Strains carrying the 5′bmrB-gfp fusion (C) or the 5′bmrC-gfp fusion (D) were grown in parallel; lincomycin was added to the BSBII-5′bmrC-gfp strain once GFP fluorescence in the BSBII-5′bmrB-gfp strain started to increase. Note that panel C shows the raw GFP expression levels while panel D shows TAU. E. Quantitative real-time PCR analysis on RNA isolated from B. subtilis 168 during transition-phase growth, either in the presence or absence of lincomycin (0.5 μg/ml).
