Figure 2.

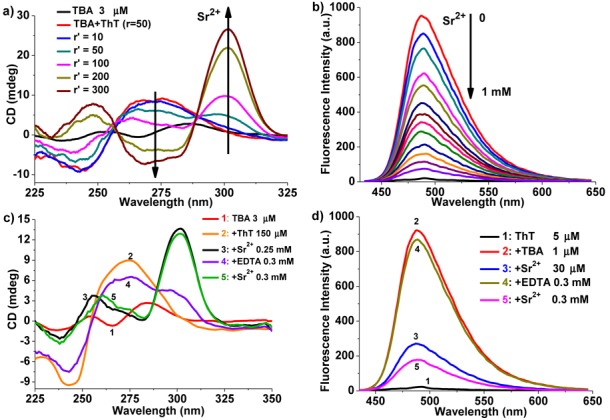
(a) CD titration of TBA (3 μM) with various concentrations of Sr2+ in the presence of ThT (150 μM). The arrows indicate increments in r′ value from 0 to 300. (r′ = [Sr2+]/[TBA]). (b) Fluorescence titration of TBA (1 μM) and ThT (5 μM) with Sr2+. The arrow from top to bottom indicates the addition of Sr2+ from 0 to 1 mM. The bottom black spectrum curve is the background signal of ThT. λex = 420 nm. (c and d) Cycling of the Sr2+-mediated structural conversion of TBA monitored by CD (c) and fluorescence (d) in the presence of ThT.
