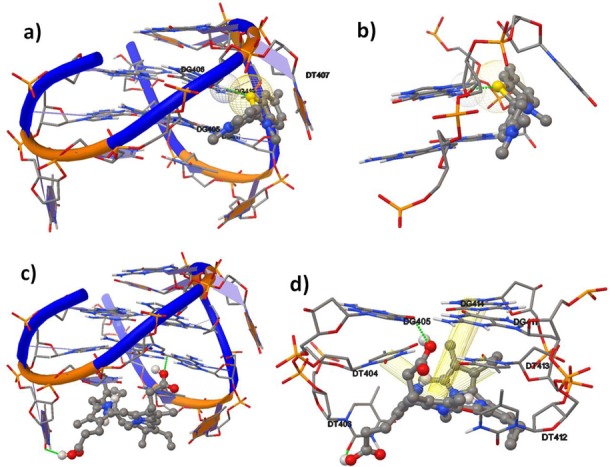
Figure 4.

The interactions between the anti-parallel quadruplex (PDB: 1HAO) and ThT (a and b) or NMM (c and d) visualized by molecular docking simulation. DNA and ThT are represented as cartoon sticks and spheres. C, gray; N, blue; S, yellow; O, red. Green dotted lines represent the hydrogen bonding between bases and ThT/NMM, and yellow cylinders represent π∼π interactions between bases and NMM. (a) Side view of the anti-parallel TBA quadruplex with ThT. (b) The interactions of ThT with two quartets in the region of groove binding. (c) Side view of the anti-parallel TBA quadruplex with NMM. (d) The interaction of NMM with the bottom quartet as well as two T loops.
