Figure 5.

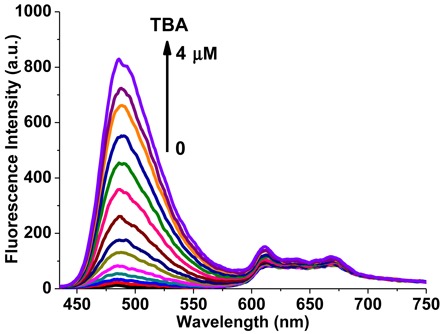
Fluorescence spectra of the mixture of 5 μM ThT and 10 μM NMM upon titration with TBA. The arrow from bottom to top represents increments of TBA from 0 to 4 μM. (λex = 410 nm).

Fluorescence spectra of the mixture of 5 μM ThT and 10 μM NMM upon titration with TBA. The arrow from bottom to top represents increments of TBA from 0 to 4 μM. (λex = 410 nm).