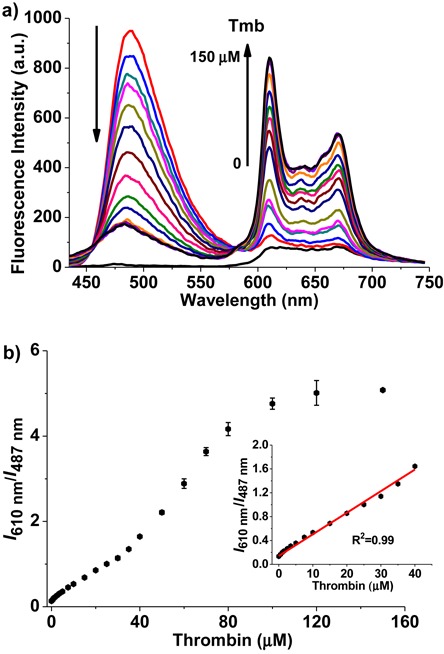
Figure 6.

(a) Fluorescence spectra of the two compounds mixed together in the presence of TBA (4 μM) upon addition of thrombin. The bottom black spectrum curve is the background signal of the mixture of ThT and NMM. The arrows indicate increments in thrombin (Tmb) concentrations from 0 to 150 μM. (b) Plot of the NMM/ThT emission intensity ratio (I610 nm/I487 nm) against the concentration of thrombin. Insert: A linear response of I610 nm/I487 nm versus thrombin concentration was observed over the range of 0∼40 μM (R2 = 0.99). All titration were carried out in 10 mM Tris-buffer, pH 7.2. (λex = 410 nm).
