Figure 5.

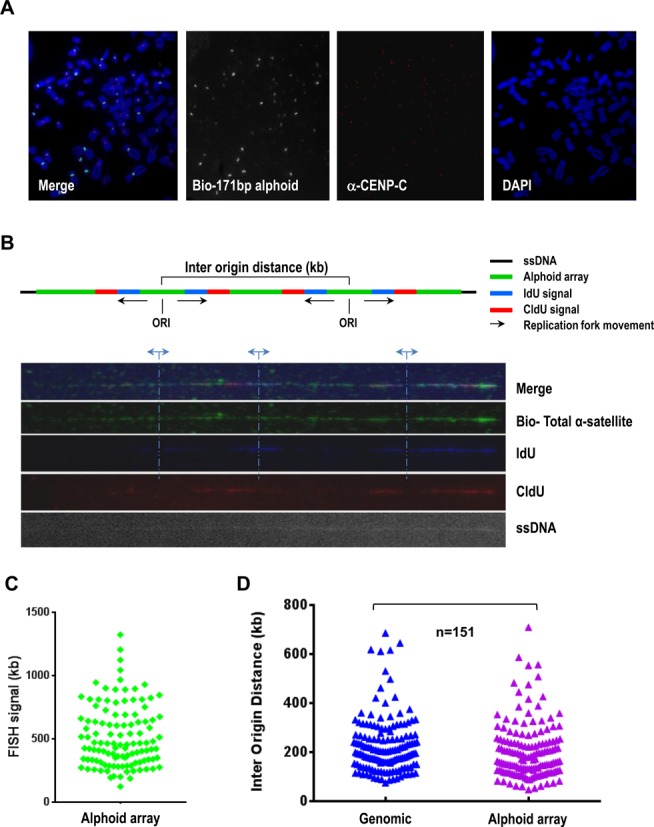
Measuring of replication fork speeds and inter-origin distances within alphoid DNA arrays. (A) Immuno-metaphase FISH assay. A biotinylated alpha-satellite consensus probe was used to visualize human centromeres. Abs against CENP-C were used to stain functional kinetochores (in red). (B) Adjacent replication bubbles were visualized on a combed DNA molecule. Cells were sequentially labeld with IdU (in blue) and CldU (in red) for 20 min. Replication origins were determined by the patterns of IdU-blue and CldU-red signals as described previously (23,24). The distance between adjacent replication origins represents the inter-origin distance. Alphoid DNA arrays were probed with a biotinylated alpha-satellite consensus probe (in green). DNA fibers were visualized by anti-single-strand DNA antibodies (ssDNA). (C) Histogram of the lengths of alphoid DNA arrays identified by an alpha-satellite consensus probe (median = 550). (D) Histogram of inter-origin distances within the alphoid DNA arrays (median = 140). Each triangle represents an inter-origin distance. The shortest measured distance is ∼48 kb and the largest is ∼710 kb. Inter-origin distances on centromeric repeats and on random chromosomal fragments were not distinguishable. P = 0.0134, Mann–Whitney test, n = 151.
