
Figure 2.
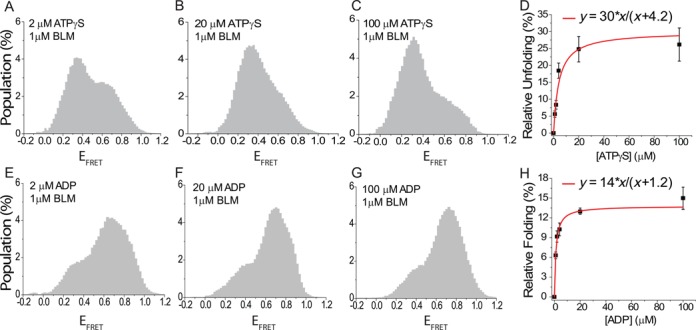
BLM-mediated unfolding for pd-hGQ12T in which ATPγS or ADP is titrated while BLM concentration is kept at 1 μM (150 mM K+, pH 7.5). (A)–(D) ATPγS titration data. (A) 2 μM ATPγS; (B) 20 μM ATPγS; (C) 100 μM ATPγS. (D) Subtraction analysis as in Figure 1E. The histogram for 1 μM BLM data, before any ATPγS is introduced as shown in Figure 1D, is subtracted from the histograms for different ATPγS concentrations in the presence of 1 μM BLM. This choice ensures that the change in the unfolded population is due to the changing ATPγS concentration. As the reference state already shows some GQ unfolding, the y-axis of the graph represents relative unfolding with respect to this reference state. The redline is a Langmuir binding isotherm fit to the data. (E)–(H) ADP titration data. The low EFRET peak decreases and the high EFRET peak increases as the ADP concentration is increased, representing an increase in the folded GQ population. (E) 2 μM ADP. (F) 20 μM ADP. (G) 100 μM ADP. (H) Subtraction analysis in which the reference histogram is that for 1 μM BLM in the absence of ADP (nt-free state with 1 μM BLM shown in Figure 1D). Unlike the previous cases, the folded population increases as ADP concentration is increased, which shows that BLM is less efficient at unfolding GQ in the ADP state compared to the nt-free state. The relative folded population is thus plotted in (H) to maintain a positive population.