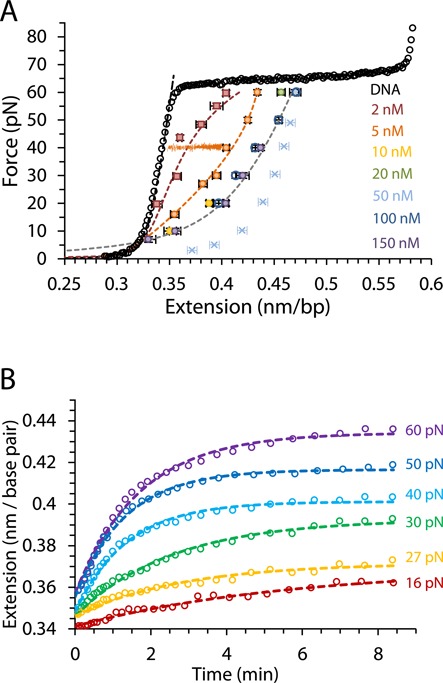
Figure 2.

(A) Average measurements of at least three DNA-ΔΔ-P complex equilibrium extensions for a range of constant forces between 7 and 60 pN at ligand concentrations of 2–150 nM are shown as color coded symbols, while an illustration of a constant force measurement approaching the equilibrium extension at 40 pN and 5 nM is also shown in orange. Circles are measurements carried out in this study for concentrations 5–150 nM and squares are previously reported measurements at 2 nM (10). Cyan crosses show non-equilibrium extensions for forces 5–50 pN obtained from averaging fast release curves (obtained with a release rate of 200 nm/s) after equilibrium extension measurements with constant force (60 pN) at 50 nM concentration. Dashed lines are fits to the DNA-ligand complex WLC model in Equation (3). (B) The time-dependent extension as a function of time (open circles) for DNA in the presence of 5 nM Δ,Δ-P at several constant forces. The dashed lines are fits to the single exponential dependence in Equation (1). Experiments were conducted at 21°C (10 mM Tris buffer, 100 mM NaCl, pH 8).
