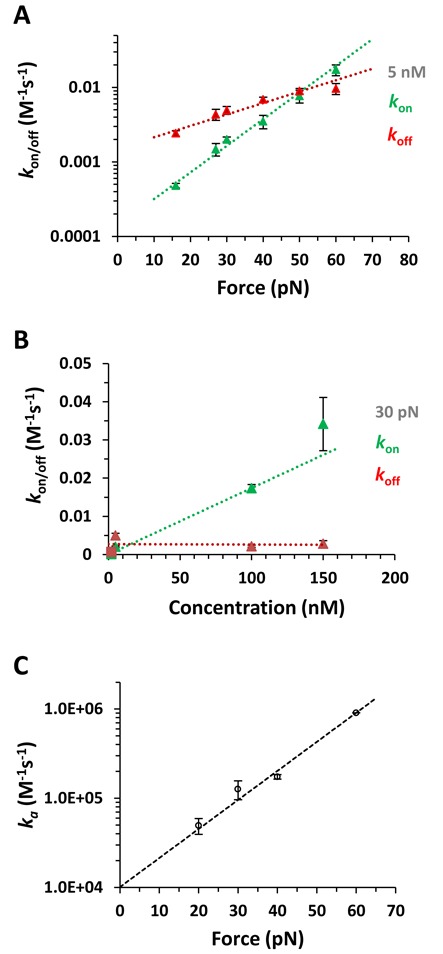
Figure 4.

(A) The on rates (kon, green data points) and off rates (koff, red data points) at a ligand concentration of 5 nM fitted to a single exponential dependence on force (dotted lines) to obtain the distances associated with the on and off transitions, xon = 0.33±0.01 nm and xoff = 0.14±0.01 nm and kon(0) = 1.6±0.1×10⁻⁴ and koff(0) = 1.4±0.1×10⁻³. (B) The on rates (kon) and off rates (koff) as a function of concentration at 30 pN force. The triangles are for concentrations 5–150 nM, squares are from analyzing previously reported kinetics at 2 nM (10), and the dotted lines are linear fits. (C) The association rates ka(F) (data points) for forces from 20 pN to 60 pN fitted to Equation (9) (dashed line), yielding the zero-force association rate ka(0) = 1.01±0.001×10⁴ M−1 s−1 and the length change required for ligand association xon = 0.31±0.01 nm.
