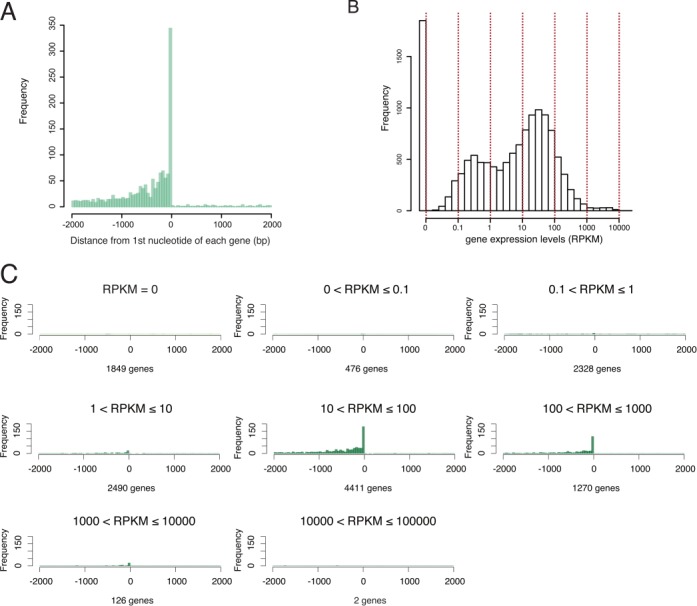
Figure 5.

The relationship between BmHP1a-binding and the transcriptional levels of BmHP1a-associated genes. (A) The distances from the first nucleotide of each gene to the end of neighboring BmHP1a peak. (B) The distribution of the transcribed genes in BmN4 cells. The genes were divided into eight groups according to the expression level. (C) The data from Figure 5A were divided into eight groups according to the expression level. The numbers of genes per group are indicated.
