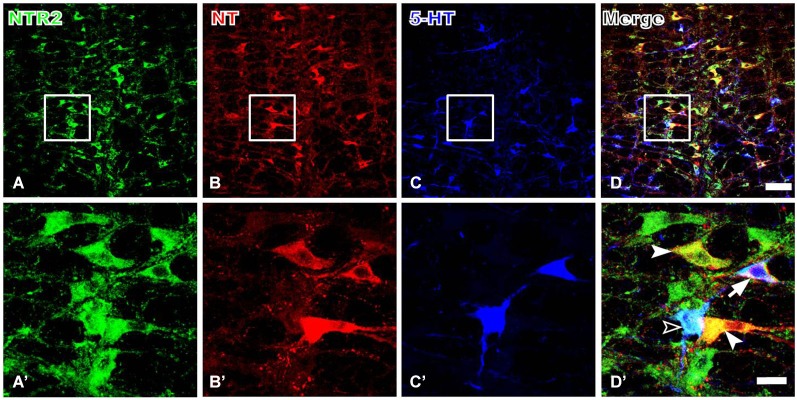
Figure 4.

Representative fluorescence photomicrographs showing NTR2- (A, green), NT- (B, red), and 5-HT- (C, blue) triple-labeled neurons in the RVM. The images from (A–C) are merged in (D). The rectangular areas in (A–D) were enlarged and displayed in (A’–D’). The filled arrowheads indicate NTR2/NT double-labeled neurons; the unfilled arrowheads indicate NTR2/5-HT double-labeled neurons; and the arrows indicate NTR2/NT/5-HT tripe-labeled neurons in the RVM (D’). Scale bar = 80 µm (A–D) or 25 µm (A’–D’).
