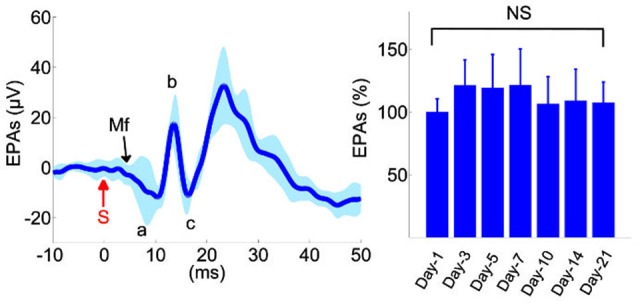
Figure 2.

Analysis of evoked potentials in the control animals (n = 6). Left: Evoked potential (EP) waveforms show sustained amplitudes over a 3-week period. Waveforms from 10 different recording days were superimposed from all animals. Evoked potential amplitudes (EPAs) of MF-mediated field potentials were calculated by averaging the triphasic potential amplitudes using the equation  . S: mechanical stimulus. Right: average MF response amplitudes from all six animals, normalized within each animal to the mean of the first day recording. None of the days were statistically different than the others (F(6,59) = 1.41, rmANOVA, repeated measures of 6 rats,1–2 trials from each, 8–11 trials per day). Total number of trials is shown in parenthesis for each day. NS: not significant.
