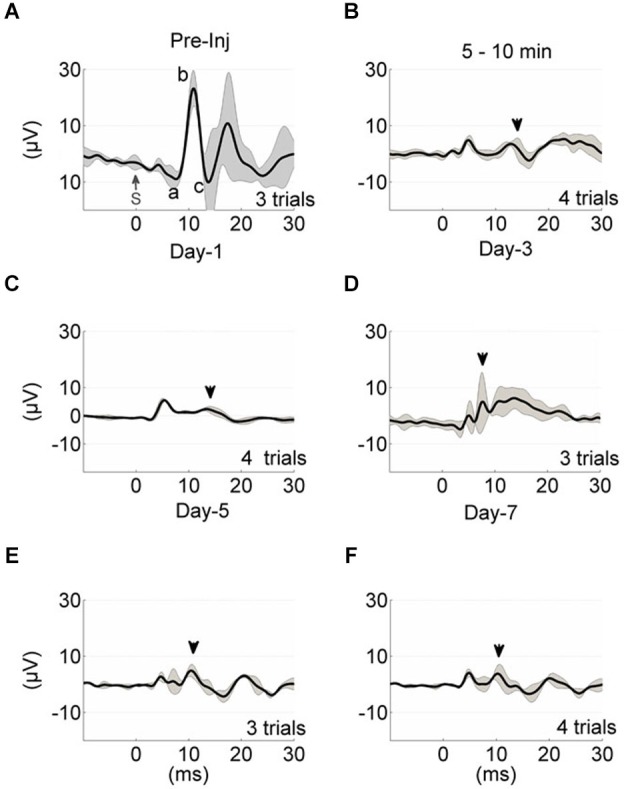
Figure 3.

Evoked potential waveform progression in a sample animal from the time of injury (A–F). Each trace represents the average of multiple trials (gray traces), and each trial is the stimulus (S, t = 0) trigger-average of 20 EPs. The black shade is the ± std. Mossy fiber-mediated potentials analyzed in Figure 2 are marked in similar manner (A, a-c; B–F, arrowheads). The pre-injury recordings were obtained 5–10 min before the application of FPI (A). Time of recording after anesthesia was ~5 min (A,C–F) and 5–10 min after FPI induction (B). All injury-day recordings showed great depression in the EP waveform and amplitudes. Day-3 EPs demonstrated larger amplitude variations; 5 ± 5 µV (D).
