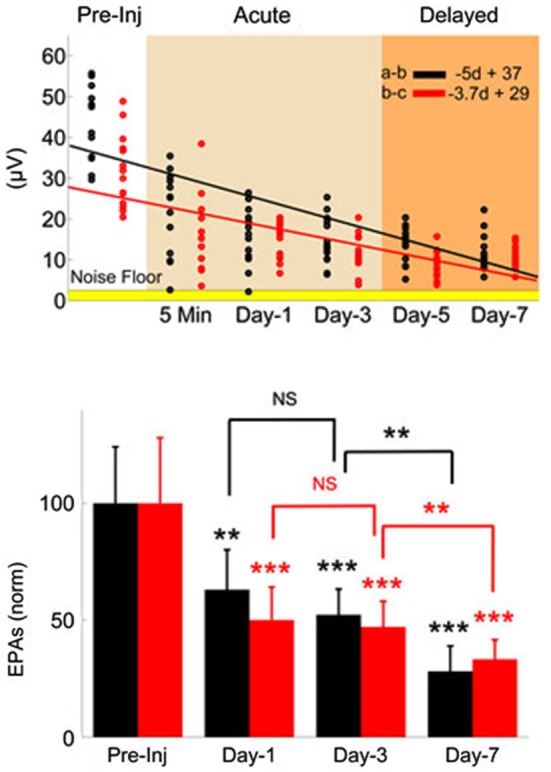
Figure 4.

Monitoring injury progression in EPAs of MF-mediated responses is presented on group data. Late MF-mediated potentials, a-b and b-c (shown in Figure 3) were analyzed individually. Top: All animals as a group demonstrated nearly a linear decreasing trend by the number of days (d) after the injury (R2 = 0.47 and 0.43, respectively). Each dot in the scatter plot shows the mean of EPAs for subsequent a-b (black) and b-c potentials (red) in a different trial (n = 9 rats, 2–3 trials per animal on a given day). Bottom: Data shown are the mean ± std of normalized EPAs for the pre-injury and three selected days of the post-injury period. Same color representations in the scatter analysis are used here (EPA(a-b); black, EPA(b-c); red). All data were normalized to mean amplitude of the pre-injury recordings (n = 9 rats, 20 total trials). Amplitude loss reached as large as 75% at the end of the 7-day survival period. Other significances shown were calculated using repeated measures of ANOVA followed by Bonferroni correction. *P < 0.05, **P < 0.005, ***P < 0.001.
