Figure 5.

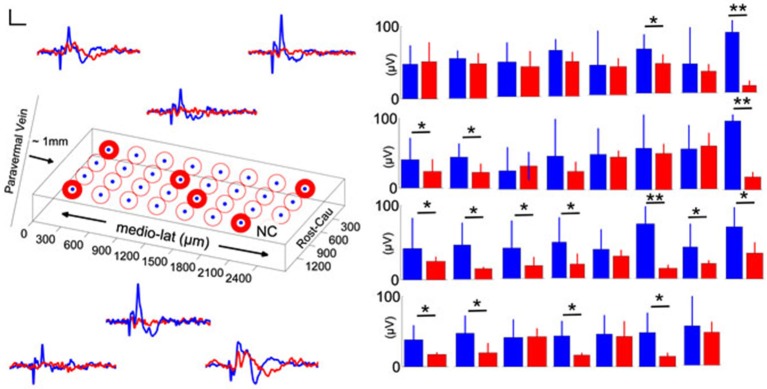
Spatial distribution of pre-injury and day-7 (blue and red traces and bars, respectively) evoked potentials in a rat. Left: Orientation of the MEA on the PML and averaged recordings from six representative electrode contacts. Differential changes in EPAs with respect to the contact position were noted (n = 2–3 trials averaged for each day in one rat). NC: no channel, scale bar = 20 µV and 20 ms. Right: Pre- and post-injury, day-7 EPA changes are illustrated for all 31-contacts. While some of the channels did not indicate a significant amplitude drop with injury, in some others the changes were drastic (9–10 trials per day; error bars show one std; paired t-test; *P < 0.05; **P < 0.005).
